
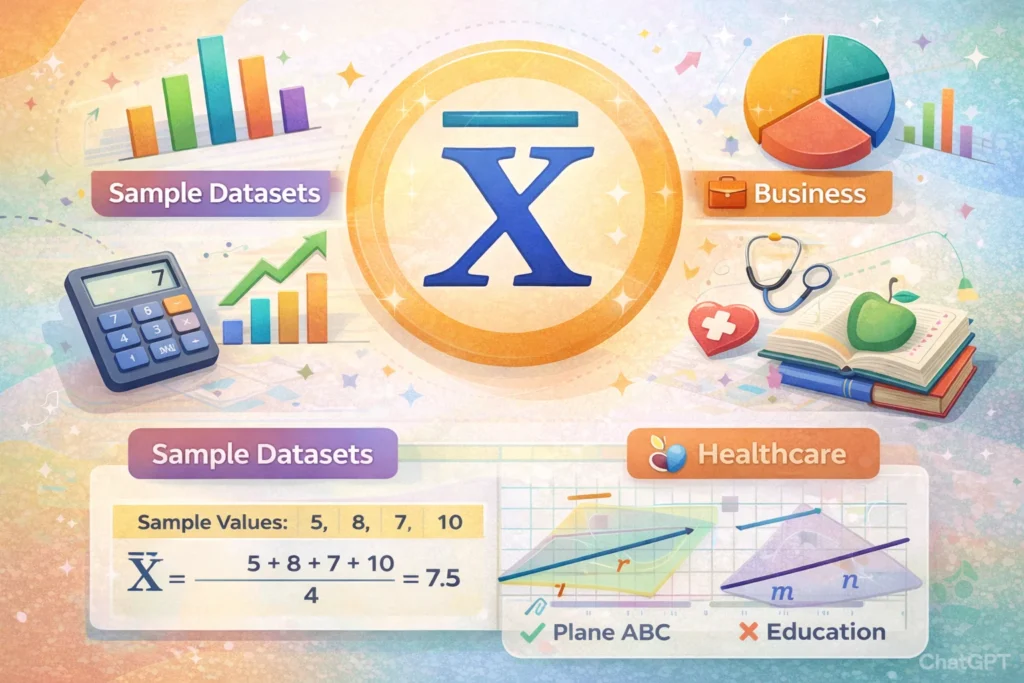
In statistics, X bar ( Xˉ\bar{X}Xˉ ) represents the sample mean, which is the average value of a set of observations in a sample.
It is calculated by adding all the sample data points together and dividing by the number of observations.
X bar is widely used to estimate the population mean and summarize data efficiently.
X bar is more than a formula; it is a tool that turns raw data into insight. By calculating the mean, statisticians and researchers can quickly identify trends, compare groups, and make predictions. For example, knowing the average height of students in a class or the mean monthly rainfall in a city gives a clear snapshot of the data without getting lost in individual variations.
In 2026, X bar continues to play a vital role in education, business, research, and technology. From analyzing user behavior online to interpreting scientific experiments, X̄ provides a simple yet powerful way to summarize large amounts of information. Understanding X bar is the first step toward making data meaningful, actionable, and easy to interpret.
Understanding X bar is fundamental in statistics, whether you are analyzing research data, conducting surveys, or studying probability. It is one of the first steps in making sense of data, and it helps statisticians, researchers, and data analysts convey insights clearly.
Origin of X Bar
The concept of the mean has been around for centuries, but the symbol Xˉbar{X}Xˉ (read as “X bar”) has roots in classical statistics notation from the 19th and early 20th centuries. Statisticians needed a concise way to represent the average of a sample instead of writing long formulas repeatedly.
- The “X” represents the variable being measured.
- The bar above signifies that it is a mean or average, distinguishing it from individual observations.
This notation became standard in textbooks, research papers, and statistical software, making it easy to communicate ideas in a universal way.
Why X Bar is Popular
X bar is a simple but powerful tool because it provides a quick snapshot of the sample data. Its popularity stems from several key advantages:
- Simplicity: Easy to compute and interpret.
- Foundation for further analysis: Used in inferential statistics like t-tests and confidence intervals.
- Data summarization: Helps condense large datasets into meaningful averages.
- Universality: Recognized across disciplines from social sciences to finance and health research.
💡 Tip: While X bar is intuitive, it is essential to remember that it reflects the sample, not the entire population. Misinterpreting it can lead to inaccurate conclusions.
How to Calculate X Bar
The formula for X bar is straightforward:Xˉ=n∑Xi
Where:
- Xi = each individual data point
- n = number of observations in the sample
Example Table of X Bar Calculation
| Observation (X) | Calculation Step |
|---|---|
| 5 | 5 |
| 8 | 8 |
| 12 | 12 |
| 10 | 10 |
| 15 | 15 |
Xˉ=55+8+12+10+15=550=10
So, X bar = 10. This is the average value of the sample.
Real-World Usage of X Bar
X bar is more than just a classroom concept; it has practical applications in daily life and professional fields:
- Business: Measuring average sales per month or customer satisfaction scores.
- Healthcare: Calculating average patient recovery times or lab test results.
- Education: Summarizing student test scores to evaluate class performance.
- Manufacturing: Determining average product dimensions to ensure quality control.
🔍 Example in a neutral tone: A school records the following student grades: 80, 85, 90, 70, 75. The X bar is (80 + 85 + 90 + 70 + 75)/5 = 80. This tells the teacher the average class performance.
Comparison with Related Terms
Understanding X bar becomes clearer when compared to other statistical terms:
| Term | Meaning | Difference from X Bar |
|---|---|---|
| μ (Mu) | Population mean | X bar is sample mean, μ is Population mean |
| Median | Middle value of a dataset | X bar uses all data, median does not |
| Mode | Most frequently occurring value | X bar represents average, mode represents frequency |
| Σ (Sigma) | Summation symbol | Used in X bar formula to sum observations |
💡 Note: X bar is an estimate of the population mean when the entire population is not accessible. It’s crucial for inferential statistics.
Alternate Meanings of X Bar
While primarily used in statistics, X bar can occasionally appear in different contexts:
- Engineering: Sometimes used to denote an average of measurements in quality control.
- Finance: Rarely, X bar may refer to a projected or estimated value in a dataset.
However, in most academic or professional settings, it is safe to assume X bar refers to the sample mean.
Polite or Professional Alternatives
If you are writing in a professional or academic context, you can use:
- Sample mean instead of X bar (more descriptive).
- Average of observations (good for general audience).
- Mean of the dataset (clarifies you are discussing data).
Using these alternatives helps avoid confusion for audiences unfamiliar with statistical notation.
Examples of X Bar in Different Tones
- Friendly: “If you add up all your test scores and divide by the number of tests, voila! You’ve got your X bar 🎉.”
- Neutral: “The sample mean, represented by X bar, provides a concise summary of the dataset.”
- Dismissive: “X bar is just the average. Nothing fancy—just sum it up and divide by n.”
Example Table of Multiple X Bar Calculations
| Sample | Data Points | X Bar |
|---|---|---|
| 1 | 4, 6, 8 | 6 |
| 2 | 10, 15, 20, 25 | 17.5 |
| 3 | 3, 3, 3, 3, 3 | 3 |
This table shows how different samples produce different X bars, reflecting the characteristics of each dataset.
Common Mistakes with X Bar
- Confusing X bar with μ: Remember, X bar is a sample mean, μ is a population mean.
- Ignoring outliers: Extreme values can skew X bar, giving misleading impressions.
- Over-relying on X bar: Always consider median, mode, and standard deviation for a full picture.
FAQs
What does X bar symbolize in statistics?
X bar symbolizes the sample mean, the average of a dataset.
How is X bar calculated?
Add all observations together and divide by the number of observations.
Is X bar the same as the population mean?
No, X bar is a sample mean and estimates the population mean (μ).
Can X bar be used with large datasets?
Yes, X bar summarizes both small and large datasets efficiently.
Does X bar account for outliers?
X bar includes all values, so outliers can affect it. Consider using median for skewed data.
What is the difference between X bar and median?
X bar is the average of all values, while median is the middle value in an ordered dataset.
When should I use X bar?
Use X bar when you want a simple, representative value for a sample or dataset.
Are there alternatives to X bar in professional writing?
Yes, you can use “sample mean” or “average of observations” for clarity.
Conclusion
X bar is a cornerstone of statistics, providing a simple yet powerful way to summarize data. From calculating student grades to analyzing business metrics, understanding how to compute and interpret X bar is essential for anyone working with numbers. Remember:
- Always distinguish between sample mean (X bar) and population mean (μ).
- Use X bar alongside other statistical measures for a full analysis.
- Be mindful of outliers that can skew your results.
Practical tip: In spreadsheets or statistical software like Excel, SPSS, or R, calculating X bar is straightforward, saving you time and ensuring accuracy.
Read More Related Articles:
- What Does “BTW” Mean? Texting Acronym You See (2026)
- What Does GBTS Stand For? Text Meaning Explained (2026)
- What Is NSF in Banking? Non-Sufficient Funds Explained Simply (2026)

Luna Hartley is a content creator at TextSprout.com, where she specializes in explaining word meanings, modern phrases, and everyday language used in texts and online conversations. Her writing focuses on clarity and context, helping readers understand how words are actually used in real communication.